
VESPER
VESPER uses a combination of mean shift algorithm and fast Fourier transform (FFT) to identify the best superimposition of two EM maps. Source codes are available here. Alignment using conventional Cross-correlation and the Laplacian filter is available in the provided code.
Introduction
VESPER Protocol
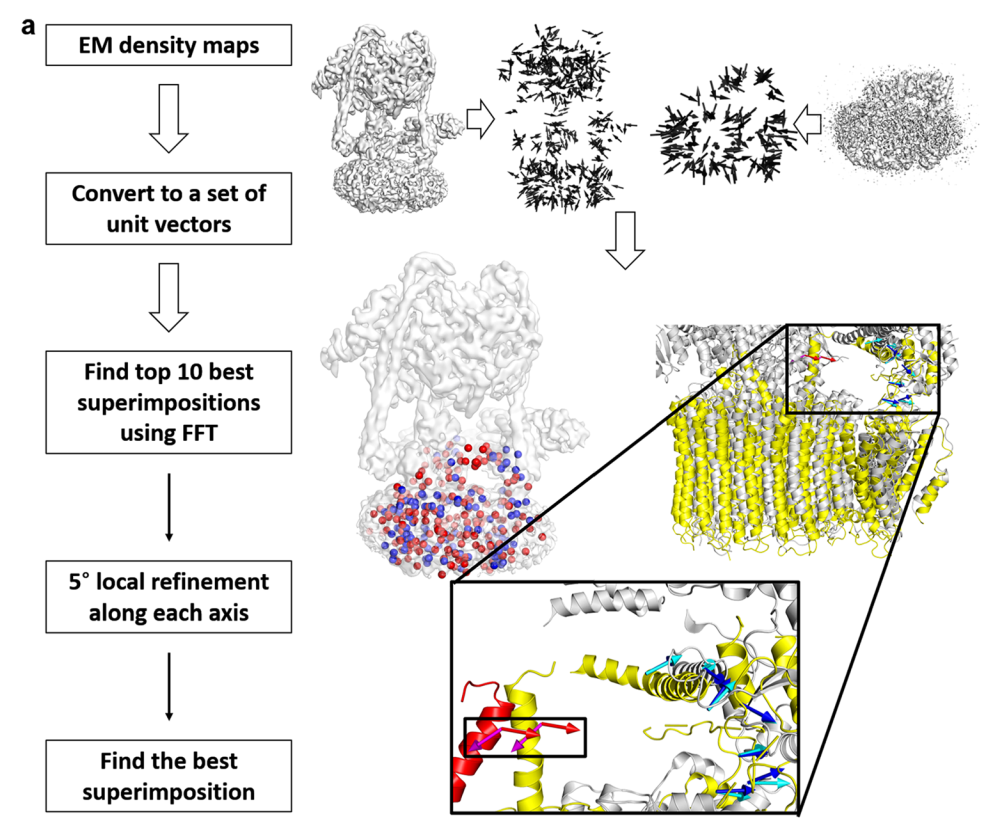
VESPER protocol consists of three steps: (1) To identify the best superimposition of two EM maps, each map is firstly converted to a set of unit vectors using the mean shift algorithm. (2) The best superimposition of two maps is identified using the fast Fourier transform (FFT). For each rotation sampled, a translation scan is performed using FFT to optimize the summation of dot products of matched vectors (DOT score). (3) For each of the top 10 models from FFT search, VESPER performs 5° local refinement along each axis and then write top 10 models after the refinement into the output file.
Flowchart of VESPER
Availability
Free Server (Recommended): https://em.kiharalab.org/algorithm/vesper
We also provided VESPER structure to map fitting tool here:https://em.kiharalab.org/algorithm/vesper(s2m)
The VESPER old web server can be accessed here. The code is available at Github.
Tech Specs
CPU: >=4 cores
Memory: >=32Gb
GPU: not required.
Usage
Usage guide
(1) Identify the best superimposition between two EM maps by VESPER.
            Usage: VESPER -a [MAP1.mrc (large)] -b [MAP2.mrc (small)] [(option)]

            ---Options---
            -t [float] : Threshold of density map1 def=0.000
            -T [float] : Threshold of density map2 def=0.000
            -g [float] : Bandwidth of the gaussian filter
             def=16.0, sigma = 0.5*[float]
            -s [float] : Sampling grid space def=7.0
            -A [float] : Sampling Angle interval def=30.0
            -c [int  ] : Number of cores for threads def=2
            -N [int  ] : Refine Top [int] models def=10
            -S: Show topN models in PDB format def=false
            -V: Vector Products Mode def=true
            -L: Overlap Mode def=false
            -C: Cross Correlation Coefficient Mode def=false
             Using normalized density value by Gaussian Filter
            -P: Pearson Correlation Coefficient Mode def=false
             Using normalized density value by Gaussian Filter and average density
            -F: Laplacian Filtering Mode def=false
            -E: Evaluation mode of the current position def=false
(2) Calculate the normalized z-score for top 10 models from VESPER. Normalized z-scores for top 10 models are written into the output file.
            python cluster_score.py:
            usage: cluster_score.py [-h] -i INPUT_FILE [-c CUTOFF] [-o OUT_NAME]


            optional arguments:
            -h, --help            show this help message and exit
            -i INPUT_FILE, --input INPUT_FILE
                        Required. Name of input file.
            -c CUTOFF             Optional. Clustering cutoff ranging from 0 to 1.
                        Default = 0.2.
            -o OUT_NAME, --output OUT_NAME
                         Optional. Name of output file. If not specified, the
                         output file would be named as input filename followed
                         by .normzscore.
Usage: VESPER -a [MAP1.mrc (large)] -b [MAP2.mrc (small)] [(option)] ---Options--- -t [float] : Threshold of density map1 def=0.000 -T [float] : Threshold of density map2 def=0.000 -g [float] : Bandwidth of the gaussian filter def=16.0, sigma = 0.5*[float] -s [float] : Sampling grid space def=7.0 -A [float] : Sampling Angle interval def=30.0 -c [int ] : Number of cores for threads def=2 -N [int ] : Refine Top [int] models def=10 -S: Show topN models in PDB format def=false -V: Vector Products Mode def=true -L: Overlap Mode def=false -C: Cross Correlation Coefficient Mode def=false Using normalized density value by Gaussian Filter -P: Pearson Correlation Coefficient Mode def=false Using normalized density value by Gaussian Filter and average density -F: Laplacian Filtering Mode def=false -E: Evaluation mode of the current position def=false
python cluster_score.py: usage: cluster_score.py [-h] -i INPUT_FILE [-c CUTOFF] [-o OUT_NAME] optional arguments: -h, --help show this help message and exit -i INPUT_FILE, --input INPUT_FILE Required. Name of input file. -c CUTOFF Optional. Clustering cutoff ranging from 0 to 1. Default = 0.2. -o OUT_NAME, --output OUT_NAME Optional. Name of output file. If not specified, the output file would be named as input filename followed by .normzscore.
1- Compile VESPER source code
Firstly download VESPER code from github.
git clone https://github.com/kiharalab/VESPER
Next, change into VESPER_code directory and compile from the source codes.
cd /your_path_to_VESPER/VESPER_code/ make cp VESPER ../
git clone https://github.com/kiharalab/VESPER
cd /your_path_to_VESPER/VESPER_code/ make cp VESPER ../
2- Identify the best fitting of two EM maps
VESPER -a [MAP1.mrc] -b [MAP2.mrc] [options] > [VESPER_output_filename]
Inputs:
VESPER expects MAP1.mrc and MAP2.mrc to be valid filenames. Supported file formats are MRC and CCP4.

Sample Inputs:
Two sample map files can be found in example_data/ folder.

Options:
-a: Name of the first map MAP1.
-b: Name of the second map MAP2.
-t: Contour level for MAP1. Default = 0.
-T: Contour level for MAP2. Default = 0.
-s: Grid spacing for both maps. We recommend to use 7. Default = 7.0.
-A: Angle spacing for fast Fourier transform (FFT) search. We recommend to use 30. Default = 30.0.
-g: Bandwidth of the Gaussian filter. Default = 16.
-c: Number of cores to use. Default = 2.
-N: The number of top models to perform local refinement. Default = 10.
-S: Show top N models in PDB format.
-V: Vector products mode. Default = true.
-C: Cross correlation coefficient mode. Density values are not normalized around the mean. Default = false.
-P: Pearson correlation coefficient mode. Default = false.
-L: Overlap mode. Default = false.
Output format: By default, VESPER writes the vector information for each of top 10 models after local refinement into VESPER output.
Vector information for the first model starts with two lines like the ones shown below:
    #0 R={0.0 0.0 5.0} \
    MTX={0.996194700 -0.087155725 0.000000000 0.087155725 0.996194700\
         0.000000000 -0.000000000 0.000000000 1.000000000} \
    T={37.335 24.247 93.200} sco= 144.563 zsco= 10.477246 \
    Overlap= 0.0871 249/2859 CC= 0.206020 PCC= 0.068408 Score= 144.6
In the first line, 0 is the index of the first model. Here the model index starts from 0.
MTX shows the rotation matrix of MAP2 relative to MAP1.
T shows the translation vector of MAP2 relative to MAP1.
sco shows the DOT score, which is the summation of dot products of matched vectors between two maps.
After these two lines, the output file shows the vector information for the first model.
Each vector is represented by two atoms, one for start position (CA) and one for end position (CB).
The number in the last column shows the fitness score, which is dot product between this vector and the matched vector in MAP1.
Fitness score ranges from -1 to 1: 1 for a perfect match, 0 if two vectors are perpendicular or there is no matched vector,
and -1 if two vectors are in the opposite direction. One example is shown below.
In this case, there is no matched vector in MAP1 for this specific vector.
Thus, fitness score in the last column is 0.00. Similar information is provided for other 9 models in VESPER output.
ATOM      1  CA  ALA     1     101.600 164.600 248.600  1.00  0.00
ATOM      2  CB  ALA     1     106.065 166.626 243.604  1.00  0.00
Usage

./VESPER -a ./example_data/emd_8724.map -b ./example_data/emd_8409.map -t 0.04 \
            -T 0.048 -s 7 -A 30 -c 5 -S > ./example_data/8724_8409_s7a30.pdb
VESPER -a [MAP1.mrc] -b [MAP2.mrc] [options] > [VESPER_output_filename]
Inputs: VESPER expects MAP1.mrc and MAP2.mrc to be valid filenames. Supported file formats are MRC and CCP4. Sample Inputs: Two sample map files can be found in example_data/ folder. Options: -a: Name of the first map MAP1. -b: Name of the second map MAP2. -t: Contour level for MAP1. Default = 0. -T: Contour level for MAP2. Default = 0. -s: Grid spacing for both maps. We recommend to use 7. Default = 7.0. -A: Angle spacing for fast Fourier transform (FFT) search. We recommend to use 30. Default = 30.0. -g: Bandwidth of the Gaussian filter. Default = 16. -c: Number of cores to use. Default = 2. -N: The number of top models to perform local refinement. Default = 10. -S: Show top N models in PDB format. -V: Vector products mode. Default = true. -C: Cross correlation coefficient mode. Density values are not normalized around the mean. Default = false. -P: Pearson correlation coefficient mode. Default = false. -L: Overlap mode. Default = false.
#0 R={0.0 0.0 5.0} \ MTX={0.996194700 -0.087155725 0.000000000 0.087155725 0.996194700\ 0.000000000 -0.000000000 0.000000000 1.000000000} \ T={37.335 24.247 93.200} sco= 144.563 zsco= 10.477246 \ Overlap= 0.0871 249/2859 CC= 0.206020 PCC= 0.068408 Score= 144.6
ATOM 1 CA ALA 1 101.600 164.600 248.600 1.00 0.00 ATOM 2 CB ALA 1 106.065 166.626 243.604 1.00 0.00
Usage ./VESPER -a ./example_data/emd_8724.map -b ./example_data/emd_8409.map -t 0.04 \ -T 0.048 -s 7 -A 30 -c 5 -S > ./example_data/8724_8409_s7a30.pdb
3- Calculate Z-score for top 10 models in VESPER output
python cluster_score.py -i [VESPER_output_file] -c [Clustering cutoff] -o [Output_file]
Input:

This program takes the VESPER output file as the input.

Options:

-i: Name of input file.
-c: Clustering cutoff (c * (Maximum DOT score – Minimum DOT score)) ranging from 0 to 1. Default = 0.2.
-o: Output filename. By default, output file would be named as input filename followed by .normzscore.

Output format: It shows the Z-score for each of top 10 models. One line for each model.

Usage:

python cluster_score.py -i ./example_data/8724_8409_s7a30.pdb
python cluster_score.py -i [VESPER_output_file] -c [Clustering cutoff] -o [Output_file] Input: This program takes the VESPER output file as the input. Options: -i: Name of input file. -c: Clustering cutoff (c * (Maximum DOT score – Minimum DOT score)) ranging from 0 to 1. Default = 0.2. -o: Output filename. By default, output file would be named as input filename followed by .normzscore. Output format: It shows the Z-score for each of top 10 models. One line for each model. Usage: python cluster_score.py -i ./example_data/8724_8409_s7a30.pdb
4- Visualize the superimpositions in Pymol
To visualize the superimpositions in VESPER output, users can load the VESPER output file into Pymol and color the vectors by their fitness score. Here we take the two maps and VESPER output provided in example_data/ as an example.
Firstly, run the code below from command line to open the VESPER output in Pymol.
pymol ./example_data/8724_8409_s7a30.pdb
Secondly, run the following commands from Pymol command line to load the map file for MAP1, show vectors as spheres, and color the vectors by their corresponding fitness score. Users can change the name of the map and output file below according to the map and output file they have.
bg_color white
set normalize_ccp4_maps, 0
load emd_8724.map
isosurface emd_8724_isosurface, emd_8724, 0.04
set transparency, 0.4
hide cartoon, 8724_8409_s7a30
show spheres, 8724_8409_s7a30
spectrum b, blue_red, 8724_8409
pymol ./example_data/8724_8409_s7a30.pdb
bg_color white set normalize_ccp4_maps, 0 load emd_8724.map isosurface emd_8724_isosurface, emd_8724, 0.04 set transparency, 0.4 hide cartoon, 8724_8409_s7a30 show spheres, 8724_8409_s7a30 spectrum b, blue_red, 8724_8409
5(optional)- Fitting by Other Scores
By default, VESPER use DOT score as the object function. But user can specify other scoring functions for map alignment.
Option:
	-L: Overlap of volume.
	-C: Linear cross-correlation (CC). Compute scalar product of the density value.
        -P: Pearson crrelation coefficient. Density values are normalized by average of
            the densty for each map. Then CC is computed.
	-F: Laplacian filter score. Laplacian filter is applied to the maps. Then CC is computed.
Option: -L: Overlap of volume. -C: Linear cross-correlation (CC). Compute scalar product of the density value. -P: Pearson crrelation coefficient. Density values are normalized by average of the densty for each map. Then CC is computed. -F: Laplacian filter score. Laplacian filter is applied to the maps. Then CC is computed.
6(optional)- Computing score for the given position.
VESPER can evaluate superimposed two maps with -E option. To use -E option, VESPER requires the same map size for input maps. UCSF Chimera can generate the resampled by vop command.
#example chimera command
open map1.mrc
open map2.mrc
vop #1 resample onGrid #0
colume #2 save resample_map2.mrc
Then, VESPER can compute DOT score between map1.mrc and resampe_map2.mrc by -E option.
./VESPER -a map1.mrc -b resample_map2.mrc -E > score.txt
Example of Output with -E option. All Rotations are 0 degree. Translatin vector is zero.
##EVALUATION OF INITIAL POSITION
Overlap= 0.0500 191/3820 CC= 0.417687 PCC= 0.082265 LAP= 324124.428184 Score= 176.7
Std= 7.037618 Ave= 36.647654
#0 R={0.0 0.0 0.0}
   MTX={1.000000000 0.000000000 0.000000000 0.000000000 1.000000000 \
        0.000000000 -0.000000000 0.000000000 1.000000000} \
   T={0.000 0.000 0.000} sco= 176.657 zsco= 19.894366
#example chimera command open map1.mrc open map2.mrc vop #1 resample onGrid #0 colume #2 save resample_map2.mrc
./VESPER -a map1.mrc -b resample_map2.mrc -E > score.txt
##EVALUATION OF INITIAL POSITION Overlap= 0.0500 191/3820 CC= 0.417687 PCC= 0.082265 LAP= 324124.428184 Score= 176.7 Std= 7.037618 Ave= 36.647654 #0 R={0.0 0.0 0.0} MTX={1.000000000 0.000000000 0.000000000 0.000000000 1.000000000 \ 0.000000000 -0.000000000 0.000000000 1.000000000} \ T={0.000 0.000 0.000} sco= 176.657 zsco= 19.894366
License
Copyright © 2021 Xusi Han, Genki Terashi, Charles Christoffer, Siyang Chen, & Daisuke Kihara. VESPER: Global and Local Cryo-EM Map Alignment Using Local Density Vectors. Nature Communications. 12.1
GPL v3 for academic use. (For commercial use, please contact us for different licensing)
Reference
Citation of the following reference should be included in any publication that uses data or results generated by VESPER program.