
EMAP2SEC+
Emap2sec+ is a computational tool using deep learning that can accurately identify structures, alpha helices, beta sheets, other(coils/turns) and DNA/RNA, in cryo-Electron Microscopy (EM) maps of medium to low resolution.
Introduction
Emap2sec+ protocol:
(1) Process cryo-EM map (*.mrc file) and change grid size to 1.
(2) Scan EM map to get voxel input and corrsponding locations and residue IDs(if with PDB structure) and save it in *.trimmap file.
(3) (Optional) Assign Structure labels by Stride (if with PDB structure).
(4) Generate *.input file which only includes voxel information and label information(if with PDB structure).
(5) Apply Phase1 Network and Phase2 Network to assign labels for each voxels and save the predictions in *pred.txt.
(6) Output the evaluation report in *report.txt (if with PDB structure).
(7) Output *.pdb and *.pml file to visualize predictions.
Tutorial
Architecture
The architecture of Emap2sec+ is summarized in the flowchart on the right.
This document will provide a detailed explanation of each step of the Emap2sec+ architecture and programs needed to run those steps. It concludes by giving a step-by-step application walk-through on a simulated and an experimental EM map.
1 Resize EM maps
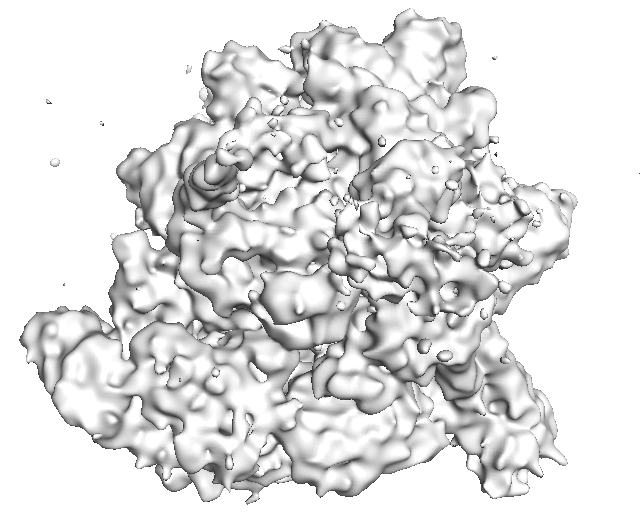
Different EM maps have different grid size. Considering that we use density values in grid points as our model’s input, we need to make them to have the same measurement across different maps. An automatic process will change the grid size of input map to 1 Å.
2. Input file generation from your EM map
The input file for Emap2sec+ is generated in two-steps and automatically finished in backend. In the first step, a program named map2train will take an EM map and map's author recommended contour level as input and generates an intermediate readable text file called [map_name].trimmap. A trimmap contains normalized electron density values of voxels. In the second step, a process will use the trimmap file to generate input file (*.input) for Emap2sec+ model, which contains density values by scanning the input map in all the 3 directions using a 11*11*11 cube with stride=2. Emap2sec+ makes structure assignment to each of these rows.
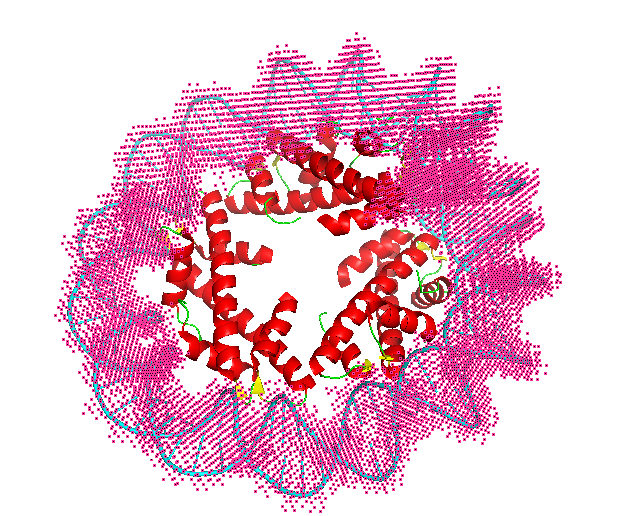
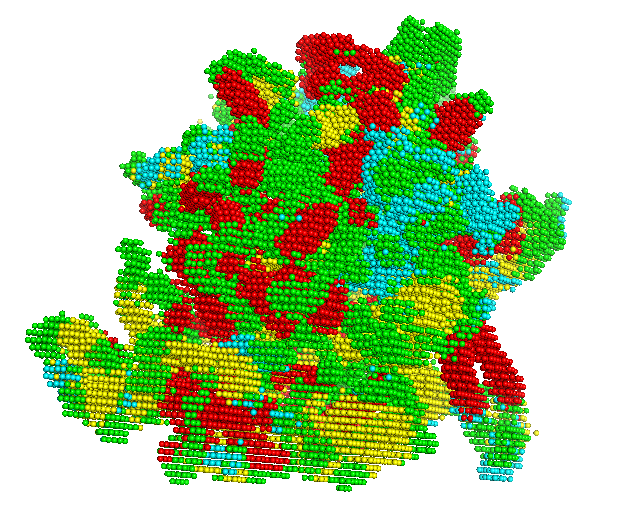
3 Emap2sec+ phase1
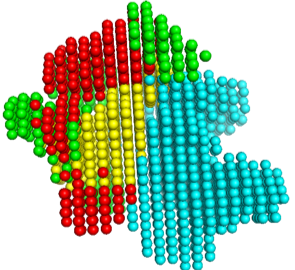
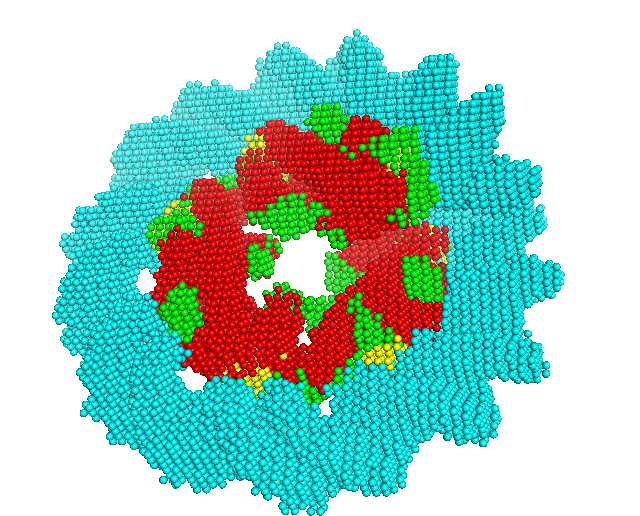
The voxel input generated in the previous step is fed to the first phase network of Emap2sec+. This step gives out probability values of helix, sheet, other protein and DNA/RNA for each voxel.
In the figure, red spheres correspond to helix predictions, yellow spheres correspond to sheet predictions, green spheres correspond to other (coil/turn) predictions and cyan spheres correspond to DNA/RNA predictions.
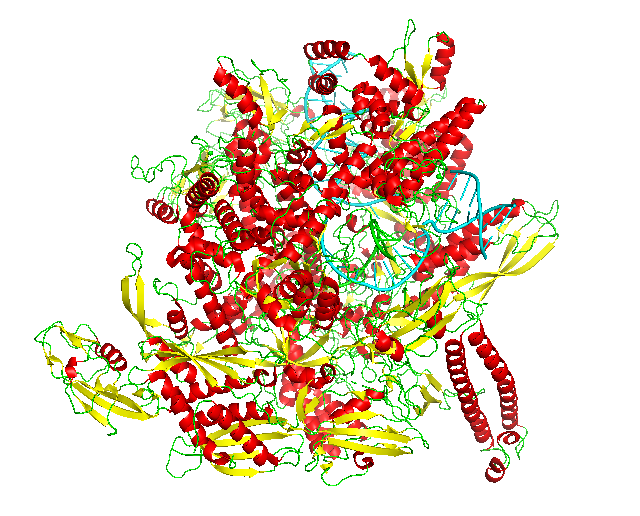
4 Emap2sec+ phase2 - Prediction smoothing
The output from the first phase is a set of predicted probabilities for each of helix, sheet, other protein structures and DNA/RNA. In this second phase, these probabilities are used to further augment predictions. The final voxel-wise structure prediction for the cryo-EM map is done using the output labels from phase 2." to the end of section 4.
Usage guide
Examples
Simulated map example (10Å resolution)
python3 main.py --mode=0 -F=[Map_path]
--type=1 --gpu=0 --class=4
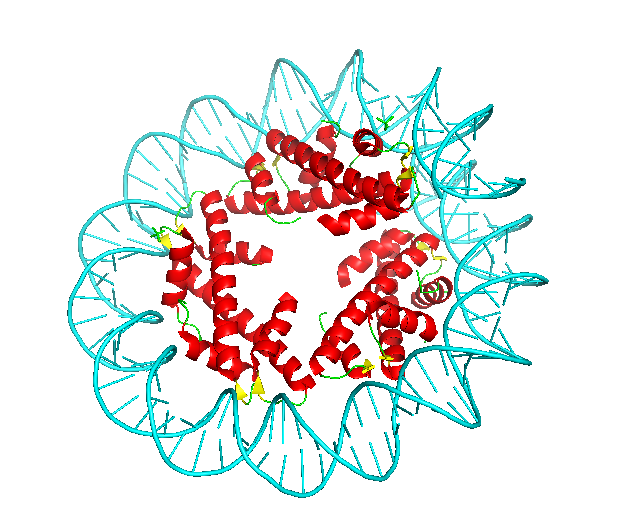
The example input map is included in 5T5K .
2 Visualize Result
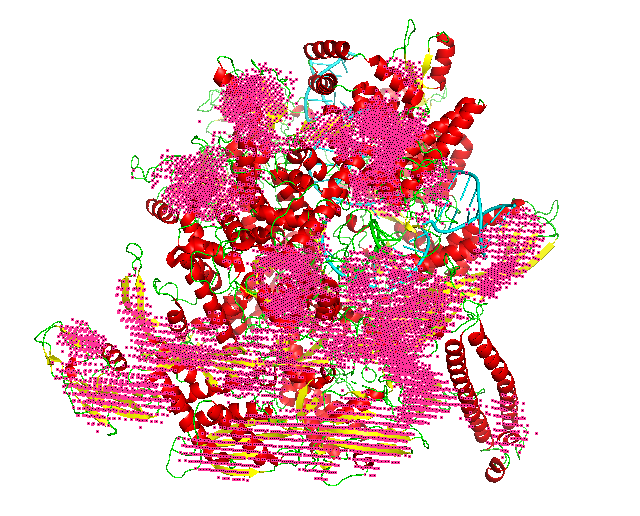
Results are saved in Predict_Result/SIMU10/[Input_Map_Name]. Phase 1 and Phase 2 visualization results (Pymol sessions) are saved in “Phase1” and “Phase2” sub-directory, respectively. You will find generated *.pml files generated to visualize. Please use “pymol -u *.pml” to visualize the final structure detection result. If you want to only see very confident detection results, run “pymol -u *C.pml” using another visualization file named "*C.pml", which only includes confident detections with a probability>=0.9.
pymol -u *.pml
3 Evaluate Performance(only when the correct underlined structure in the map is known)
In the case that you are testing the software with a case, you can check the accuracy of the structure detection by Emap2sec+ by comparing the result with the known structure. This mode cannot be used in real scenarios where the native structure is not available. We usually use the mode to evaluate Emap2sec+ performance on testing dataset with known structures to verify its performance. This mode is also useful to measure the difference of the detected structure by Emap2sec+ with the structure currently assigned to the EM map.
python3 main.py --mode=1 -F=[Map_path] ---P=[PDB_Path]
 type=1 --gpu=0 --class=4
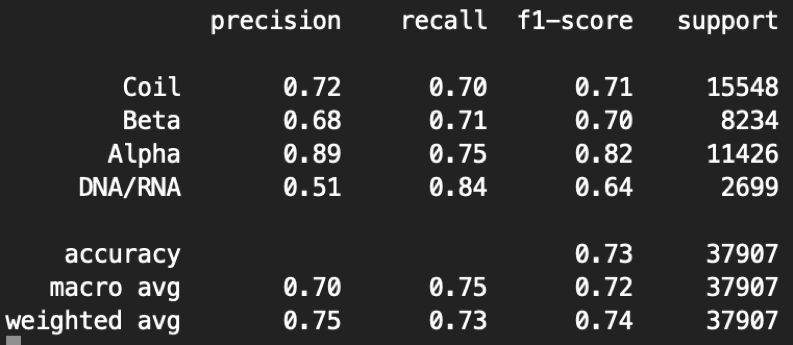
In the Predict_Result_WithPDB/SIMU10/[Input_Map_Name], our evaluation report will be saved in *_report.txt.
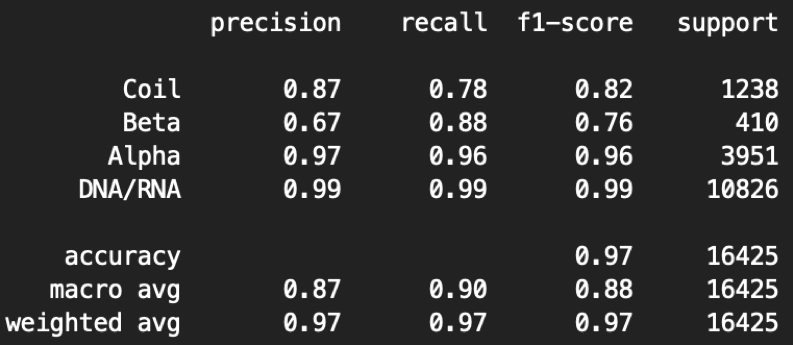
Here is an example of our evaluation report of 5T5K.
python3 main.py --mode=1 -F=[Map_path] ---P=[PDB_Path]
type=1 --gpu=0 --class=4
Here the precision is the fraction of correct predicted structures among the specific predicted structure, while recall (also known as sensitivity) is the fraction of the total amount of the specific structure that were actually retrieved. The F1 score is the harmonic mean of the precision and recall. The support is the number of voxels with the structure label. The macro measurement means macro-averaging(taking all classes as equally important), while the micro means mirco-averaging (biased by class frequency).
Experimental map example
python3 main.py --mode=0 -F=[Map_path] –type=3 --gpu=0
 --class=4 --fold=3 -–contour=0.006
If the map grid size is smaller than 1, you also need to specify –-resize=1 to resize the grid size in the command line. This will make the command run slower than the default mode. The example input map is included in 6BJS, which is in the fold 3 testing dataset
python3 main.py --mode=0 -F=[Map_path] –type=3 --gpu=0
--class=4 --fold=3 -–contour=0.006
2 Visualize Result
Results are saved in Predict_Result/REAL/Fold3_Model_Result/[Input_Map_Name]. Phase 1 and Phase 2 visualization results (Pymol sessions) are saved in “Phase1” and “Phase2” sub-directory, respectively. You will find generated *.pml files generated to visualize. Please use “pymol -u *.pml” to visualize the final structure detection result. If you want to only see very confident detection results, run “pymol -u *C.pml” using another visualization file named "*C.pml", which only includes confident detections with a probability>=0.9.
pymol -u *.pml
3 Evaluate Performance(only when the correct underlined structure in the map is known)
In the case that you are testing the software with a case, you can check the accuracy of the structure detection by Emap2sec+ by comparing the result with the known structure. This mode cannot be used in real scenarios where the native structure is not available. We usually use the mode to evaluate Emap2sec+ performance on testing dataset with known structures to verify its performance. This mode is also useful to measure the difference of the detected structure by Emap2sec+ with the structure currently assigned to the EM map.
python3 main.py --mode=1 -F=[Map_path] ---P=[PDB_Path]
 --type=3  --gpu=0 --class=4 -–fold=3 -–contour=0.006
In the Predict_Result_WithPDB/REAL/Fold3_Model_Result/[Input_Map_Name], our evaluation report will be saved in *_report.txt. Here is an example of our evaluation report of 6BJS.
python3 main.py --mode=1 -F=[Map_path] ---P=[PDB_Path]
--type=3 --gpu=0 --class=4 -–fold=3 -–contour=0.006
Here the precision is the fraction of correct predicted structures among the specific predicted structure, while recall (also known as sensitivity) is the fraction of the total amount of the specific structure that were actually retrieved. The F1 score is the harmonic mean of the precision and recall. The support is the number of voxels with the structure label. The macro measurement means macro-averaging(taking all classes as equally important), while the micro means mirco-averaging (biased by class frequency).
Availability
Free Server (Recommended): https://em.kiharalab.org/algorithm/emap2sec+
You can also run Emap2sec+ on Goole Colab.You can also run Emap2sec+ on CodeOcean.
Full codes of Emap2sec+ are available at GitHub.
Running our code ocean capsules
1. First, you need to create an account on code ocean using academic credentials and login into your account.
2. Then, click on the links above and go to the desired code ocean capsule.
3. To make a reproducible run i.e. run the code on an example input provided by us, click on the "Reproducible Run" button in the top right corner. This will start running the code on our example, and the results will be generated in the results folder at the bottom right after the execution is complete.
4. To run the code on an input of your choice, first go to our capsule and click on the "Edit Capsule" button in the top right corner. This will make a copy of our capsule which you can edit. Follow the instructions about how to upload and run your input in this copied capsule by reading the readme file present in the respective code ocean capsules.
Other details specific to the respective capsules can be found in the readme files of the capsules. For more details on how to run code ocean capsule please visit: Code Ocean user documentation
Tech Specs
CPU: >=4 cores
Memory: >=10Gb
GPU: any GPU supports CUDA with more than 12GB memory.
License
Copyright © 2020 Xiao Wang, Eman Alnabati, Tunde W Aderinwale,Sai Raghavendra Maddhuri, Genki Terashi, Daisuke Kihara and Purdue University
Emap2sec+ is a free software for academic and non-commercial users.
It is released under the terms of the GNU General Public License Ver.3 (https://www.gnu.org/licenses/gpl-3.0.en.html).
Commercial users please contact dkihara@purdue.edu for alternate licensing.
Reference
Citation of the following reference should be included in any publication that uses data or results generated by Emap2sec+ program.
Xiao Wang, Eman Alnabati, Tunde W Aderinwale, Sai Raghavendra Maddhuri Venkata Subramaniya, Genki Terashi, & Daisuke Kihara. Detecting Protein and DNA/RNA Structures in Cryo-EM Maps of Intermediate Resolution Using Deep Learning. Nature Communications 12, 2302 (2021)
The simulated EM map dataset used in this paper is available at SIMU_MAPS