
CryoREAD
CryoREAD is a computational tool using deep learning to automatically build
full DNA/RNA atomic structure from cryo-EM map.
CryoREAD Algorithm (20 min video) is made available at our lab's YouTube channel.
Introduction
CryoREAD protocol:
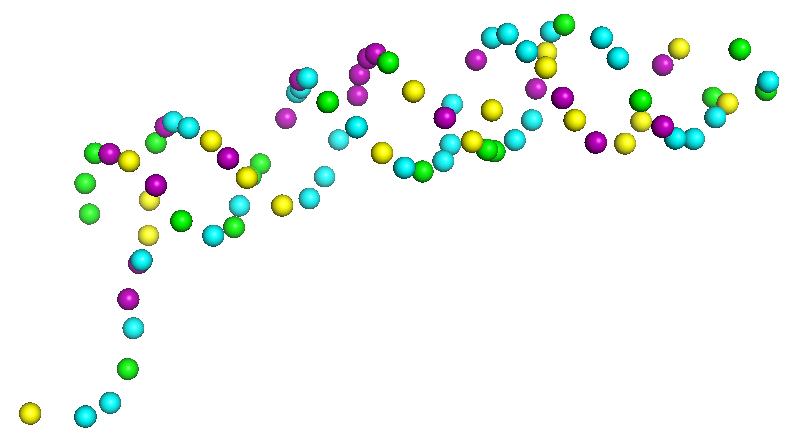
(1) Structure Detection by Deep Learning: locations of phosphate, sugar, base, and four base types are detected by two-stage networks.
(2)Structure Node Clustering: representative nodes are identified through clustering from detected grid positions.
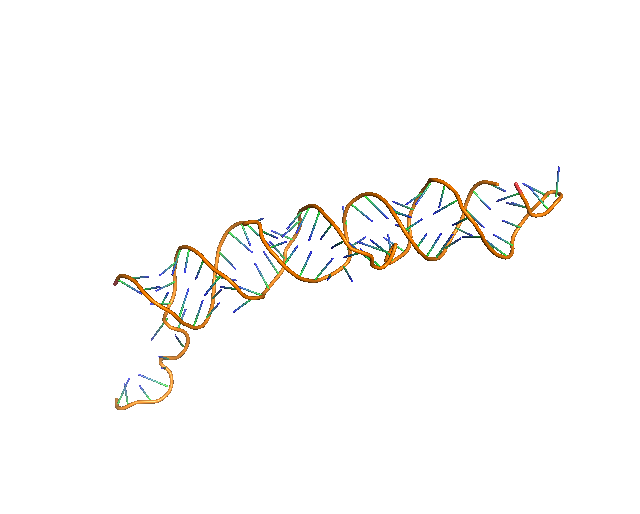
(3) Backbone Tracing: the backbone is traced by the graph constructed with representative sugar nodes.
(4) Sequence Assignment: Sequences are assigned to local fragments along the backbone path, which are then assembled in the subsequent step.
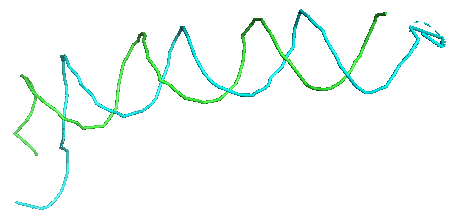
(5) Full Atom Model: full nucleotides are constructed according to triangles of phosphate, sugar, and base (S-P-B) node followed by atomic structure refinement.
Tutorial
Architecture
The network architecture of CryoREAD is summarized in the right figure.
a, the network architecture. The entire network consists of two stages of U-Net networks and here we show the 1st stage networks. It concatenates two U-Net architectures. They are 3D U-shape-based convolutional Network (UNet) with full-scale skip connections and deep supervisions. The channel size of different layers is also illustrated in the figure. b, The Encoder Block (Enc1 in panel a); c, The Merge Encoder Block (MEnc); and d, the Decoder Block (Dec). Conv3D, a 3-dimentional (3D) convolutional layer with the filter size of 3*3*3, stride 1 and padding 1. BatchNorm, a normalization layer that takes statistics in a batch to normalize the input data. ReLU, Rectified Linear Unit, a commonly used activation layer.
CryoREAD Pipeline
1 Structure Detection by Deep Learning
To start the structure modeling procedure, the probability that phosphate, sugar, and base locate at each grid position of an input density map is computed by a deep neural network. The input map is scanned with a 643 Å^3 box along the map grid of an interval of 1 Å by moving with a stride of 16 Å. The box takes density values at each grid point in the box as input features and outputs the probabilities that heavy atoms of protein, sugar, phosphate, and base for each grid point. The network architecture consists of two networks, stage 1 and stage 2, where the stage 2 network further refines the initial stage 1 output by considering the probabilities assigned by the stage 1 network. The network architecture is shown above.
2. Structure Node Clustering
To trace the backbone from detection results, we first cluster grid points with detected structure classes to choose representative nodes and connecting representative nodes classified as sugar to construct backbone structure candidates. The clustering aims to reduce the number of grid points and to identify representative points for a structure class. Clustering was applied for all but protein class (i.e. seven classes in total; sugar, phosphate, base, and four bases, which are A, C, G, U/T).
3. Backbone Tracing
First, the representative nodes of the sugar prediction are connected into a graph. Only sugar nodes were used to trace the backbone since the detection accuracy for sugar was higher than phosphate and considering sugar was sufficient for tracing. Edges are connected between sugar nodes depending on the sugar probability of the nodes and the distance between them. Then, we traced backbones of nucleic acids with a Vehicle Routing Problem (VRP) solver. The VRP is similar to the Traveling Salesman Problem (TSP), but it uses multiple “vehicles” instead of a single “salesman” to connects edges in a graph while minimizing connecting costs. We found VRP is more suitable since a map may include multiple nucleic acid chains.
4 Sequence Assignment
Here we assign nucleic acid sequences to sugar nodes in the paths. This process has two sub-steps, assigning base sequence fragments to paths, and the assembly of assigned sequences. In the initial base sequence assignment, sugar backbone paths are cut into segments of 20 representative nodes by a sliding window with a stride of 2, which are aligned with the nucleic acid sequence to identify the top 20 candidate sequence fragments using a dynamic programming algorithm. Subsequently, assigned sequence fragments are assembled by a constraint programming (CP) solver, which maximizes the sum of the probability score of sugar nodes with the assigned bases while satisfying constraints that are required for consistency of overlapping path segments and nucleic acid sequences. Overall, this step can further refine the initial base assignment to further improve the base type assignment for structures.
5. Full Atom Model
Up to this step, the structure consists of the sugar backbone and base assignment to representative sugar nodes. Then, to the sugar nodes, phosphate and base nodes that are close and satisfy a distance condition are added (see Methods). Next, a full-atom nucleotide 3D structure of the standard conformation is superimposed to each triangle of sugar, phosphate, and base nodes. Finally, structure is further refined by using phenix.real_space_refine[23] on predicted RNA regions followed by all_atom_refine in Coot[13], which both refine a model structure by considering map density information.
Usage guide
Examples
2 Detection by Deep Learning
python3 main.py --mode=0 -F=example/21051.mrc -M=best_model --contour=0.3 --gpu=0 --batch_size=4 --prediction_only
The predicted probability maps are saved in [Predict_Result/(map_name)/2nd_stage_detection] with mrc format. It will include 8 mrc files corresponding to 8 different classes. Here (map_name) is 21051. 3 Build structure without sequence information
python3 main.py --mode=0 -F=example/21051.mrc -M=best_model --contour=0.3 --gpu=0 --batch_size=4 --resolution=3.7 --no_seqinfo --refine
The automatically build atomic structure is saved in [Predict_Result/(map-name)/Output/Refine_cycle[k].pdb] in pdb format, here default k is 3. However, it may fail if your dependencies are not properly installed, then you may only find Refine_cycle1.pdb or Refine_cycle2.pdb. Here (map_name) is 21051. 4 Build structure with sequence information
python3 main.py --mode=0 -F=example/21051.mrc -M=best_model -P=example/21051.fasta --contour=0.3 --gpu=0 --batch_size=4 --rule_soft=0 --resolution=3.7 --refine
The automatically build atomic structure is saved in The automatically build atomic structure is saved in [Predict_Result/(map-name)/Output/Refine_cycle[k].pdb] in pdb format, here default k is 3. However, it may fail if your dependencies are not properly installed, then you may only find Refine_cycle1.pdb or Refine_cycle2.pdb. Modeled structures without considering sequence information are also saved as [Predict_Result/(map-name)/Output/CryoREAD_noseq.pdb] (without refinement). Meanwhile, structures only considering the sequence information without connecting gap regions are saved in [Predict_Result/(map-name)/Output/CryoREAD_seqonly.pdb] (without refinement) for reference. Here (map_name) is 21051. Compared to previous structures, only sequence assignments will be changed and overall structures are similar. 5 Output Results
The example output results are included here.
Availability
We have three publicly available platforms, which basically offer the same functionality.
Input: cryo-EM map+sequence file (optional). Output: modeled structure. The input and output is the same across all platforms.
Web Server (Recommended): https://em.kiharalab.org/algorithm/CryoREAD
Simply upload your files to run CryoREAD then the full structure is visualized online.
Google Colab: https://bit.ly/CryoREAD
Step-by-step instructions are available. Limited by redistribution constraints of Coot and Phenix, the structure here is not refined and may include atom clashes. For free user, colab has 4-hour running time limit and may not work for large structure(>=1000 nucleotides).
Local installation from GitHub: https://github.com/kiharalab/CryoREAD
Full code is available here and it is easier for user to modify to develop their own tools.
It provides two additional supports:
1. Detection Output: This option outputs probability values of detected phosphate, sugar, base, and base types, computed by deep learning, in the map, for users reference.
2. Refinement pipeline: structures from other source can be refined in the specified EM map.
Tech Specs
CPU: >=8 cores
Memory: >=50Gb. For maps with more than 3,000 nucleotides, memory space should be higher than 300GB if sequence is provided.
GPU: any GPU supports CUDA with more than 12GB memory.
License
Copyright © 2023 Xiao Wang, Genki Terashi, Daisuke Kihara and Purdue University
CryoREAD is a free software for academic and non-commercial users.
It is released under the terms of the GNU General Public License Ver.3 (https://www.gnu.org/licenses/gpl-3.0.en.html).
Commercial users please contact dkihara@purdue.edu for alternate licensing.
Reference
Citation of the following reference should be included in any publication that uses data or results generated by CryoREAD program.
Xiao Wang, Genki Terashi, & Daisuke Kihara. De novo structure modeling for nucleic acids in cryo-EM maps using deep learning. Nature Methods. 20(11): 1739-1747 (2023)
The output structures and detection maps benchmarked in this paper is available here
© 2025 KIHARA Bioinformatics LABORATORY, PURDUE University | Design by TEMPLATED.