An analytic tool for Gene Ontology Visualization and Similarity
Contents
Database Information
Score Definitions
- Resnik Semantic Similarity
- Lin’s Semantic Similarity
- Relevance Semantic Similarity
- Co-occurrence Association Score
- PubMed Association Score (PAS)
- Interaction Association Score (GO_IAS)
- Functional Similarity Score (Funsim)
- GO Parents
- GO Set
- GO Enrichment
- Protein Set
- Download NaviGO Codes
- Link from PFP and ESG function prediction servers
Update Logs
Major Update: We have integrated GO_Summary, based on our work GO2Sum, along with NaviGO to generate human-readable functional summaries from GO Terms.
Major Update: The entire NaviGO database has been updated with latest Gene Ontology and GO_Slim data (as of December 10, 2024).
Minor bugs of the Funsim score calculation is fixed at 2021-10-25 18:00:00.
Database Information:
Currently, GO database is downloaded and updated from Amigo website every month and latest database update is done at 2024-11-14 18:41:14, and there are total 40664 GO terms, 26493 BP terms, 10149 MF terms and 4022 CC terms. GO Slim terms (generic) are also updated monthly from the GO slim page in the Gene Ontology website. GO slim terms are indicated with asterisk (*) in NaviGO output pages.
the recent update was done 2024-11-04 12:53:38. IAS total pairs: 13945909, PAS total pairs: 5255249, CAS total pairs: 5610201. The background statistics of the genome GO annotation used to compute GO Enrichment is dynamically taken from UniProt restful API .
Score Definitions:
Pairwise GO Score - Resnik Semantic Similarity
Resnik’s similarity[1] measures the semantic similarity for “is-a” ontologies according to the lowest common ancestor (LCA) of a pair of GO terms.
Here p(c) is the probability of a GO term c, which is defined as the fraction of the occurrence of c in the GO Database. The root of the ontology has a probability of 1.0. s(c1,c2) is the set of common ancestors of the GO terms c1 and c2.
Pairwise GO Score - Lin’s Semantic Similarity
Lin’s similarity[1] is based on the information content of LCA and the GO term pair queried. The similarity between the two terms is defined as the ration of the commonality of the terms and the information needed to fully describe the two terms.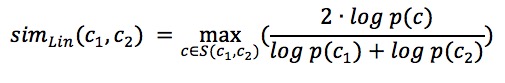
Pairwise GO Score - Relevance Semantic Similarity
The relevance semantic similarity score[1] (simRel) for computing functional similarity of a pair of GO terms, c1 and c2: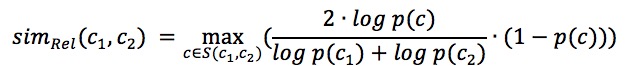
The first term considers the relative depth of the common ancestor c to the depth of the two terms c1 and c2 while the second term takes into account how rare it is to identify the common ancestor c by chance.
Pairwise GO Score - Co-occurrence Association Score (CAS)
CAS and PAS are scores for capturing functional coherence (relevance) of proteins. CAS[2] was designed to quantify the frequency of co-occurrences of two GO terms in a single gene annotation relative to random chance and is computed as follows: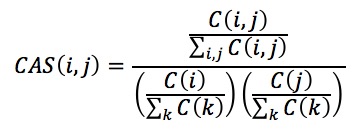
where C(i,j) is the number of sequences in the database that contain both the GO terms i and j. Similarly, C(i) is the total number of sequences annotated with the GO term i, and so is the C(j). CAS also includes GO hierarchy information in scoring the term pairs.
Pairwise GO Score - PubMed Association Score (PAS)
PAS[2] is based on the number of times a given GO term pair occurs in the PubMed Abstracts of National Center for Biotechnology information (NCBI). PAS was computed in the same way as CAS.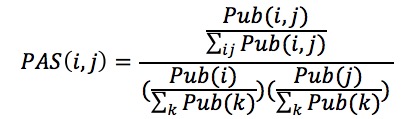
Here, Pub(i,j) is the PubMed abstracts count which contain both the GO terms i and j. Similarly, Pub(i) is the number of abstracts that contain GO term i and the same is applicable for Pub(j).
Pairwise GO Score - Interaction Association Score (GO_IAS)
The GO term Interaction Association Score (GO_IAS)[3] is for predicting protein-protein interaction from their GO term annotation. IAS quantifies the tendency that a GO term pair occur in interacting proteins by normalizing the GO term pair co-occurrence count observed in interacting proteins with the total number of protein-protein interactions and also with the number of times each of the participating GO term is used for protein annotation in the interaction data. The GO_IAS for each GO term pair was computed as follows:
where N(GOx-GOy) is the number of times GO term pair GOx and GOy interact in the PPI network, #T.Edges is the total number of true positive protein-protein interactions, N(GOx) and N(GOy) are the number of times GO term GOx and GO term GOy independently occur in the network, and #T.Nodes is the total number of unique proteins in the interaction network.
Pairwise Protein Score - Functional Similarity Score (Funsim)
To quantify the functional similarity of two proteins, both of which are annotated with a set of GO terms, we used the funsim score[4]. The funsim score of two sets of terms, GOA and GOB of respective size of N and M, is calculated from an all-by-all similarity matrix sij.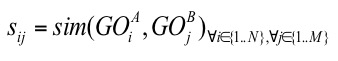
sim(GOiA, GOjB) is any kind of GO pair similarity score (Resnik/Lin/Relevance/IAS/CAS/PAS) score for GOiA, GOjB. When using one of the the semantic similarity scores (Resnik, Lin or Relevance), since they are defined only for GO pairs of the same category, a matrix is computed separately for the three categories, Biological Process (BP), Molecular Function (MF), and Cellular Component (CC). Then, the GOscore of the matrix of each GO category is computed as follows:
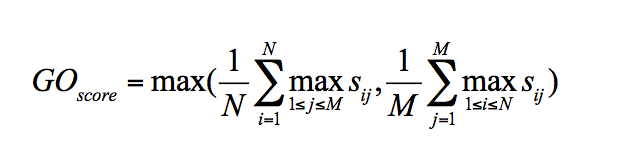
GOscore will be any of the three category scores (MFscore, BPscore, CCscore). Finally the funsim score is computed as

where max(GOscore) = 1 (maximum possible GOscore) and the range of the funSim score is (0,1).
How to use this website
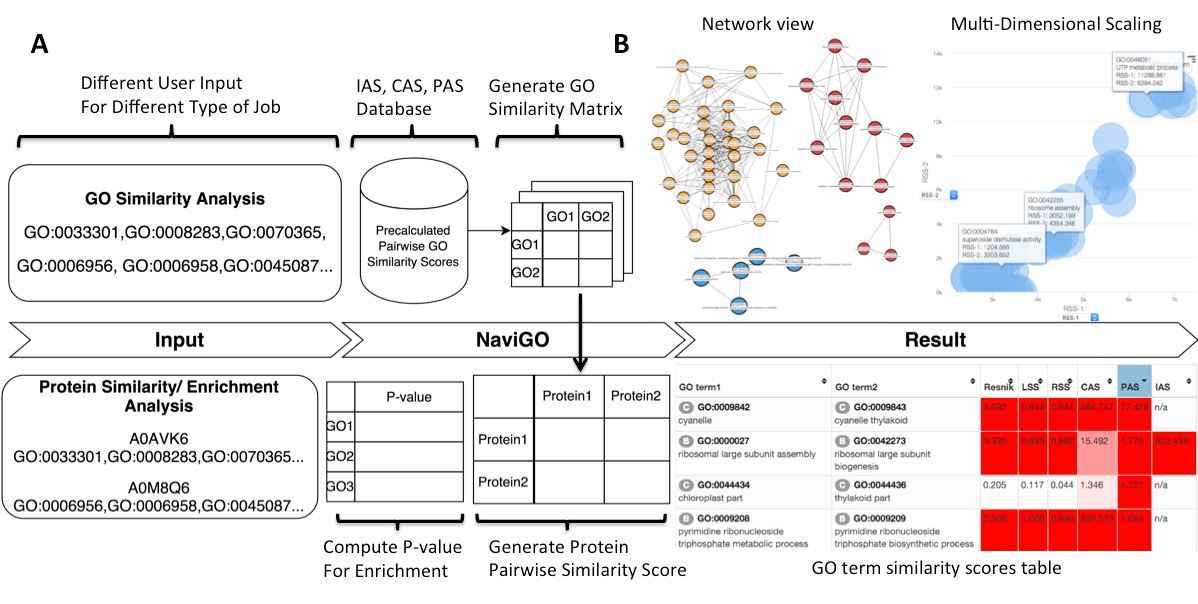
fig.1.A Sample data input and workflow for NaviGO. 1.B The resulted output of NaviGO
GO Parents
This tool is for visualizing the input GO terms in the GO hierarchy and list parental GO terms of the input GO terms. In the visualization, the GO terms will be circled with bold black in the hierarchy. Parental terms for that GO terms will be listed in the text area below the visualization.
The GO relation types are indicated by edge colors, is_a: black; replaced_by: magenta; negatively_regulates: yellow; part_of: blue; positively_regulates: cyan; regulates: red.
GO Set:
Users can input two or more GO terms and compute their similarity using 6 scores, Resnik score, Lin's Semantic Similarity (LSS), Relevance Semantic Similarity (RSS), CAS, PAS, and IAS.
The results are shown in 3 different ways, which are made available in 3 different pages, "GO Set Result", "Network Visualization", and "Multidimensional Scaling Visualization". Example job
At the top of Result page, a window shows the user-input GO terms with the number of times they appeared in the input. The count of appearance is useful, for example, when GO term predictions from multiple methods are analyzed, because terms that are predicted consistently by methods can be easily found.
From the GO set Result page,
"Open BP/MF/CC Visualizer" buttons will invoke GO term visualizer, which show the submitted GO terms along with their parental terms.
Scores of the GO term pairs are listed in the table. Resnick, LSS, and RSS scores are not computed if two GO terms have from different categories. PAS, CAS, IAS are not shown if the score was not computed due to the lack of observation in the dataset used. Two terms can be visualized by clicking the "vis" button and common parental terms are shown by clicking "parents" in the right-most column. The table can be downloaded in a CSV file by clicking "Download table as CSV".
Example of the result table. GO pairs are sorted by different scores.
At the "Network Visualization" page (select from the tabs),
users can visualize similarity of GO terms by a network. GO terms in different categories are shown in different colors (BP, red; MF, blue; CC, yellow). Similarity cutoff values can be controlled to define edges.
Example of Network Visualization.
At the Multidimensional Scaling (MDS) Visualization page (select from the tabs),
GO similarity are visualized by a statistical dimension-reduction method named MDS. Scores for x-axis and y-axis can be chosen by users. In case GO terms have the same score, the centers of the circles of the terms are shifted by a small amount to a random direction to avoid complete overlap. By clicking GO terms in the right panel, positions of the GO terms in the map are indicated. For a score, e.g. RSS, 1 and 2, e.g. RSS-1 and RSS-2, indicate the distance computed as the first axis and the 2nd axis of the scaling.
For more information about MDS, see wikipedia page .
Example of MDS.
GO Enrichment:
Enrichment of GO terms [4] in the input proteins will be computed and their p-values are computed. The server will automatically identify the organism based on the UniProt ID of the first input protein but users can specify the organism in the Organism window. The server will connect to Uniprot
database to through their RESTful
service and automatically retrieve the organism information.
The result page lists GO terms sorted by calculated p-value. The p-value tells how rare (significant) it is to have enrichment of the GO term in the protein set considering the number of proteins in the set, the number of proteins with that GO term in the organism, and the number of proteins in the organism. GO terms of significant p-value (0.00005) (or top 30 GO terms, whichever smaller) will be
visualized in the GO hierarchy.
The number of GO terms to visualize can be controlled manually by users. The enriched GO terms are color-mapped according to the p-value of enrichment on the GO DAG visualizer.
The p-value is computed as follows:
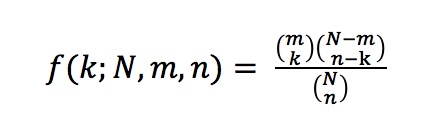
The probability of a GO term X being annotated to a protein in the group of input proteins is computed by:
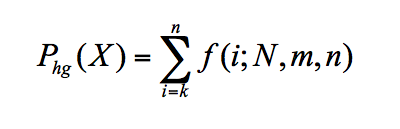 where k is the number of proteins in the group annotated with X, N is the number of annotated proteins in the organism, m is the number of proteins in the organism annotated with X, and n is the number of annotated proteins in the cluster. To calculate a p-value for overrepresentation of a term, we use the following equation:
The result can be also downloaded by clicking the "Download as CSV" button.
where k is the number of proteins in the group annotated with X, N is the number of annotated proteins in the organism, m is the number of proteins in the organism annotated with X, and n is the number of annotated proteins in the cluster. To calculate a p-value for overrepresentation of a term, we use the following equation:
The result can be also downloaded by clicking the "Download as CSV" button.
 Example job
Protein Set:
The server takes more than two proteins with their GO annotations, which can be input manually or a file with the information can be uploaded. NaviGO can also accept the file in the CAFA (Critical Assessment of Function Annotation) format (the first 50 proteins are read).
Then, NaviGO computes pairwise functional similarity between each protein pair. By checking the "Pairwise Protein Comparison", the result of each pair is separately shown. The protein functional similarity is evaluated using 8 different scores: the Funsim score of the Relevance Semantic Similarity (RSS) score of 3 GO categories (MF, BP, CC), Funsim of RSS of individual MF, BP, or CC, Funsim of RSS of BP and MF, Funsim using PAS, Funsim using CAS, and Funsim using IAS.
In the Protein Similarity Graph panel, a graph of protein similarity can be drawn, where nodes are proteins and edges indicate similarity between two proteins above a similarity cutoff value. The cutoff can be controlled by users.
Pairwise similarity scores are shown in the Protein Pairwise Similarity Scores table. The color code shows 5 levels of score significance, red to gray for high to low. It indicates that the score is within top 1%, 5%, 10%, and 20% for red to gray, respectively, relative to the score distribution of the all protein pairs of an organisms specified at the pull-down menu. Median shows significance based on the average of the values of 5th and 6th genomes (i.e. median) when the 10 genomes in the list are sorted in the descending order of their corresponding cutoff values. The table can be downloaded as a csv format table.
 Example non-pairwise job
Download NaviGO Codes
The entire codes for constructing NaviGO are made available at Github, NaviGO page . Codes for GO Visualizer, the plugin for real-time rendering of GO DAG, is also made available at GitHub GO Visualizer page .Link from PFP and ESG function prediction servers
NaviGO is linked from the output page of PFP and ESG servers, so that predicted GO terms can be analyzed by NaviGO. The output page of PFP and ESG has a link named [Analyze with NaviGO], which transfer predicted GO terms with medium or high confidence to NaviGO's GO set functionality.References
1. Schlicker A, Domingues F, Rahnenführer J, Lengauer T: A new measure for functional similarity of gene products based on Gene Ontology. BMC Bioinformatics 2006, 7. [PubMed]
2. Chitale M, Palakodety S, Kihara D: Quantification of protein group coherence and pathway assignment using functional association. BMC bioinformatics 2011, 12:373.[PubMed]
3. Yerneni S, Khan I, Wei Q, Kihara D: IAS: Interaction specific GO term associations for predicting Protein-Protein Interaction Networks. IEEE Transactions on Computational Biology and Bioinformatics~(TCBB) 2015, [Epub ahead of print][PubMed]
4. Hawkins T, Chitale M, Kihara D., Functional enrichment analyses and construction of functional similarity networks with high confidence function prediction by PFP., BMC Bioinformatics, 11:265.(2010)[PubMed]